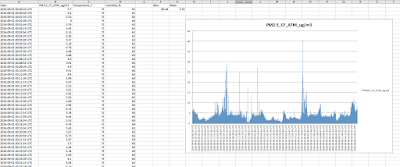
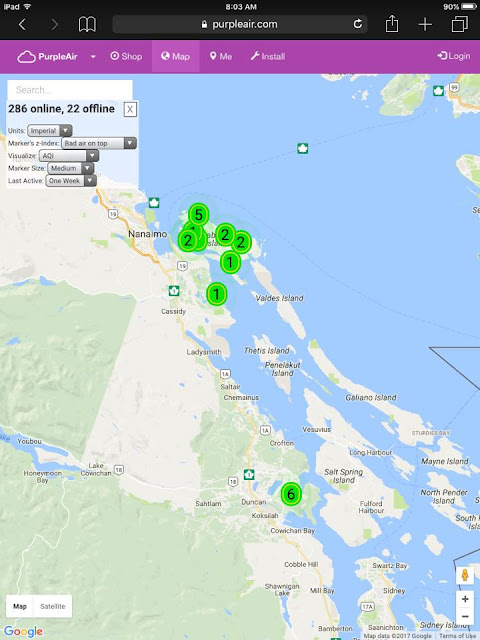
Over the past two years the Gabriola Island Clean Air Society has worked with community groups and individuals to setup more than 50 low-cost, realtime air quality monitors in BC. These devices m ade by PurpleAir have created a more nuanced and detailed picture of our air sheds, and also have provided much needed empirical evidence to support the claim that wood burning from a variety of sources creates local pollution hot spots that are not being detected by provincial air quality monitoring. The accuracy of these instruments has been questioned by some, in part, because people are often uncomfortable with the results. Residential wood burning including the use of fireplaces, wood stoves, bon fires, and yard clearing exposes people who live nearby to air pollution risks that are hyper local, and as high (but on an ongoing albeit episodic basis) as forest fire smoke. The forest fires unfolding in the interior of British Columbia this past week provide some important glimpses in

Comments
Post a Comment